

Your first hour
Marolum is running and you are signed in as the bootstrap administrator. This page walks through the first hour: securing the account you just used, reading the readiness checklist, and learning what each page of the console is for.
First ten minutes
- Create your own account. Open Administration → Users & Access and create an
administrator account for yourself. Sign out, sign back in as yourself, and keep the
bootstrap
adminaccount as the recovery path rather than the account people use. - Retire the bootstrap file. Unset
MAROLUM_LOCAL_ADMIN_PASSWORD_FILEin your deployment, delete the password file, and restart. The file was read once; it does nothing now except sit there. - Check access and observation. Open Administration → Backends → Connection diagnostics and check for Reachable. Then open Overview → Backends to inspect observation health and Stacks to verify the intended state was actually read. A reachable namespace can still contain unreadable or invalid checkpoints; Troubleshooting separates these cases.
- Wait a minute. The first checkpoint cycle commits within about a minute of startup and populates Stacks. Update history follows on its five-minute cycle and populates Operations.
The first-run readiness checklist
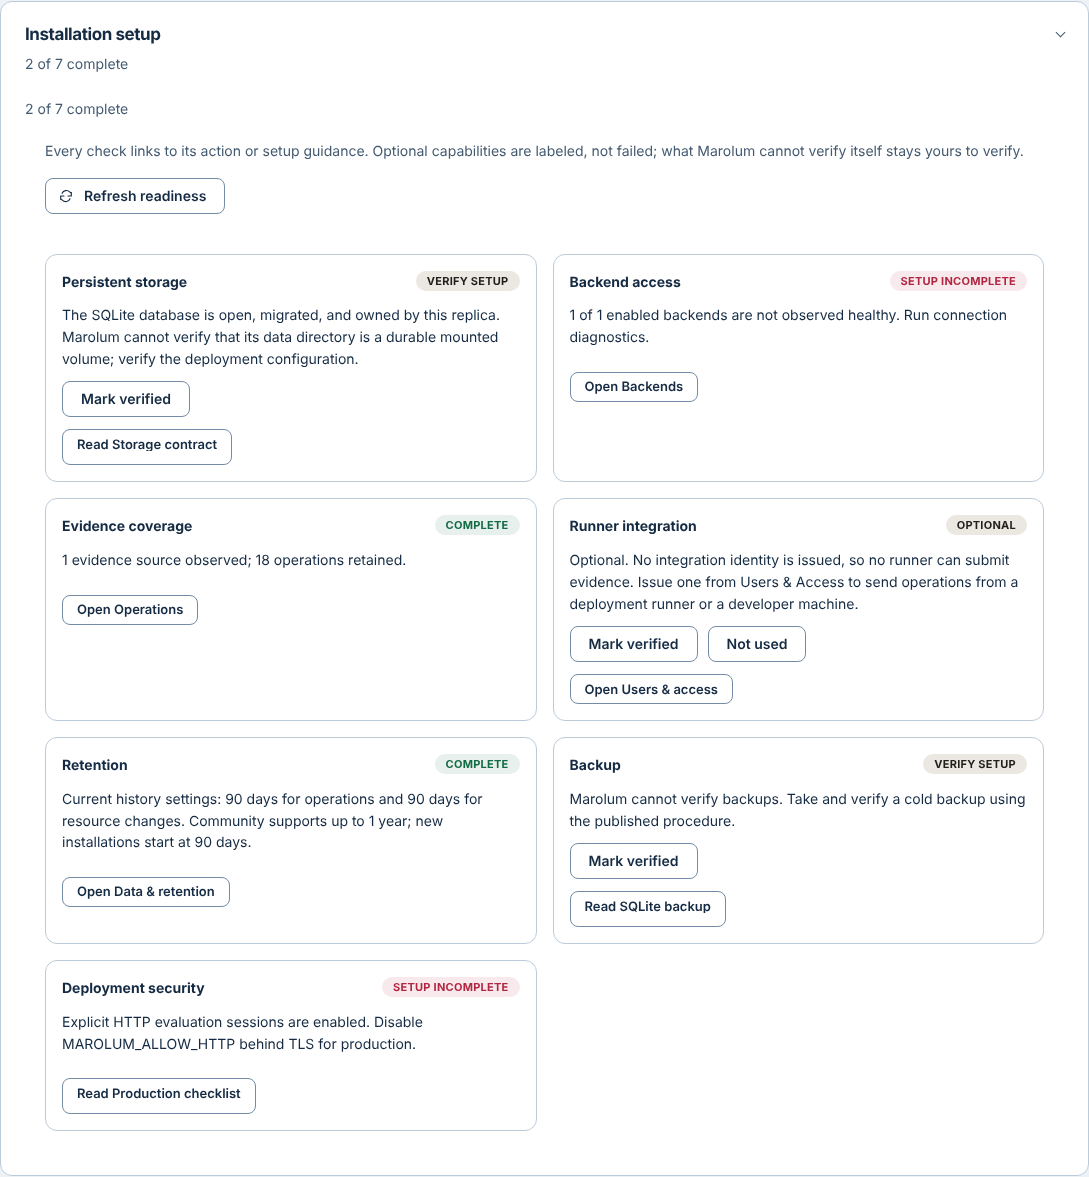
Open Administration → Backends, then expand Installation setup. It reports seven checks; each is either something Marolum can verify itself or something only you can.
| Check | What it establishes | What you still verify |
|---|---|---|
| Backend access | Every enabled backend is observed healthy for reads; otherwise the check needs attention | Verify least-privilege credentials independently; diagnose connection and observation failures in Backend problems |
| Persistent storage | The current SQLite or PostgreSQL database passed its readiness check | Verify the SQLite durable volume and single owner, or the PostgreSQL durability and deployment configuration; see Database |
| Backup | Operator verification is required | Take and test the backup appropriate to the actual database; see Backup and disaster recovery |
| Evidence coverage | History is ready, at least one source is observed, and no observed source is stale | Inspect disclosed coverage and gaps; restore current observation when the check needs attention |
| Retention | Current operation and resource-change retention settings are available | Review the actual policy under Data & retention; new installations start at 90 days, with Community supporting up to 365 days |
| Deployment security | The console reports the session-cookie configuration | Verify external TLS and deployment policy independently; leave MAROLUM_ALLOW_HTTP unset outside the documented loopback case |
| Runner integration | Optional; it reports whether a usable identity exists and whether runner evidence or correlation has been observed | Follow Runner correlation verification if used; old evidence does not prove current connectivity |
Verify setup is not a failure. It marks the checks where a green light from inside the container would be a false claim.
A tour of the console
The sidebar contains Overview, Stacks, Operations and Analytics. The profile menu opens Administration, Display options, Help & capabilities and About Marolum. Administration shows only the pages your role permits. The sidebar collapses to an icon rail; click its empty space to expand it. Display options contains theme and time-display preferences.
Overview
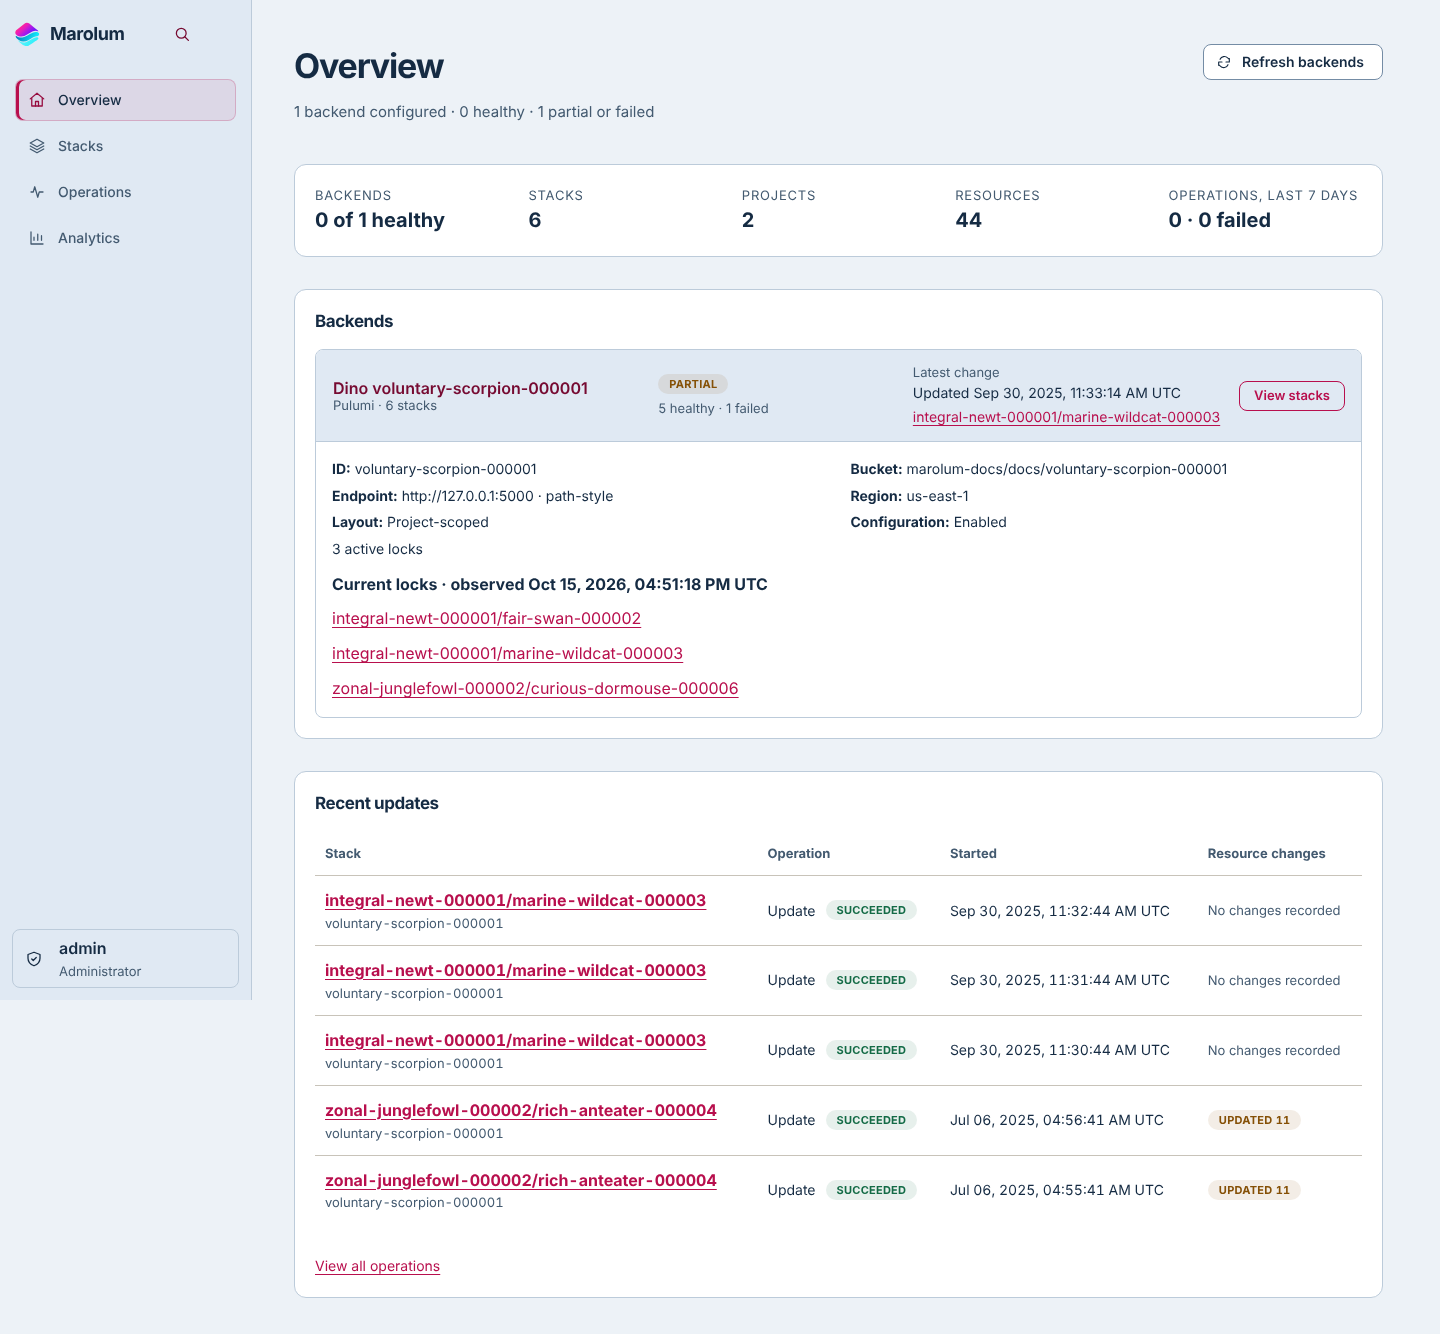
Backends shows configured backends, observed stack counts, observation health and the latest recorded change. Expand a backend for its storage details. Connection diagnostics are separate, under Administration → Backends → Connection diagnostics; stack details show whether a snapshot is current or retained after a failed read. It is the "is everything being watched" page. With no configured backends, use Add backend for a cloud source or ask your operator to configure a filesystem/PostgreSQL source. File configuration and durable console additions are described in Connect a backend.
Stacks
The inventory, grouped by backend, project, and stack, with filters for backend, backend type, and a name search. Open a stack to reach the stack explorer:
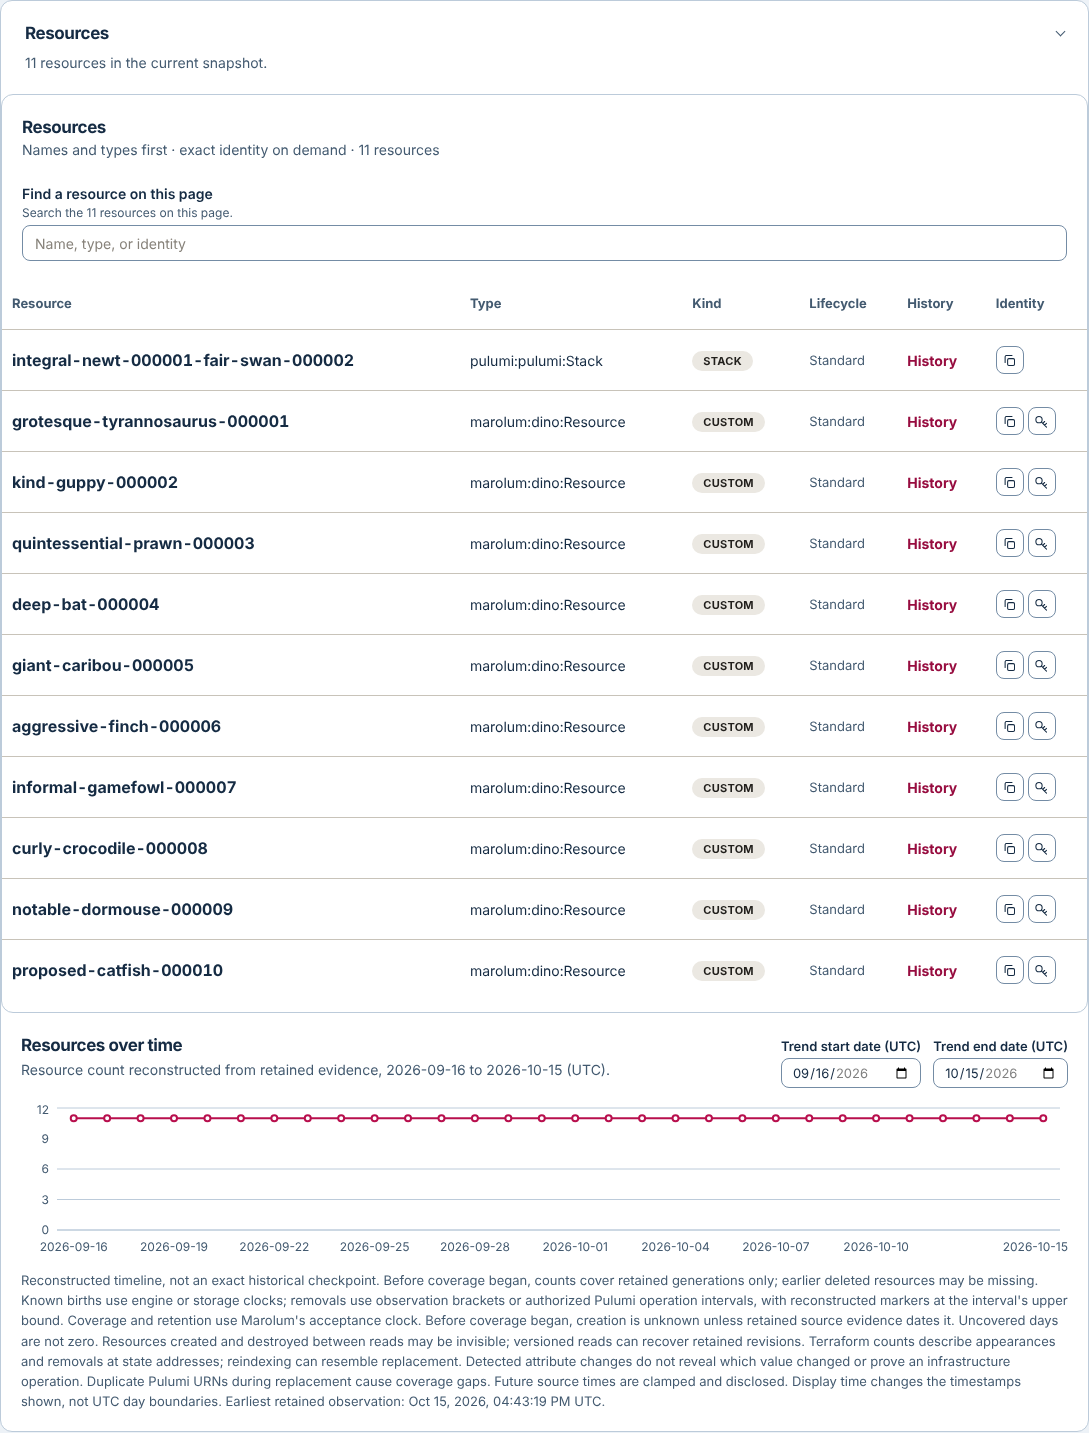
- Resources: every resource in the current checkpoint, by URN, type, and name, with a search box.
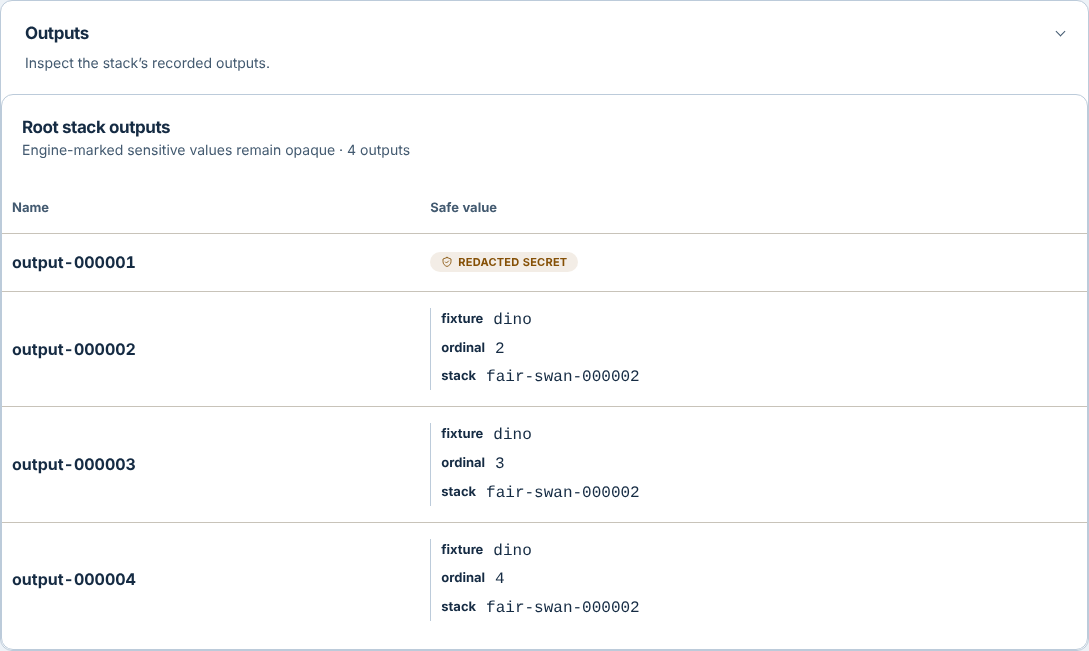
- Outputs: the stack's exported values. Pulumi-marked secrets are redacted before they reach the browser. Unmarked plaintext is shown as Pulumi stored it.
- Operation history: the retained updates for this stack. Each row expands to a per-kind breakdown of created, updated, replaced, deleted, and unchanged resources when the evidence names them, and says plainly when it does not.
- Active locks: a Pulumi lock currently held on the stack, with its identity and when it was observed.
- Observation: when the current snapshot was taken and whether it is the latest or a last-successful view after a failed read.
A stack whose latest read failed keeps showing its last good snapshot, labelled Showing the last available inventory. Marolum never shows a half-read state.
Operations
The cross-stack timeline. Every operation Marolum has observed or been told about, newest first, with its outcome, its resource impact, and where the evidence came from. Filters live in the URL, so a view is a link. Reading the operation timeline explains every column and banner.
Analytics
Aggregate outcomes over an analysis window: success rate, operations per day, destructive resource actions, average and longest duration, and a daily trend. Each figure links back to the operations behind it. The window measures evidence first recorded in the window; imported history may have run earlier. Segmenting by backend, project, or stack requires Business.
Administration
| Page | What it is for | Requires |
|---|---|---|
| Backends | Backend records, diagnostics, and the first-run readiness checklist | backends:read, diagnostics permission |
| Users & Access | Accounts, roles, integration tokens, identity providers, stack scopes | accounts:manage, integrations:admin |
| Data & Retention | Retention windows, expiry health, purge, forget, legal holds, deletion history | operations:retention:manage, operations:purge |
| Notifications | Email via your SMTP server (all editions); signed webhooks (Business) | Administrator |
| Licensing | Activate a connected license, read the installation ID, see effective entitlements | accounts:manage |
| Database | Storage provider status and the guided PostgreSQL adoption (Business) | Administrator |
A viewer sees none of these. That is the point of the viewer role.
What "normal" looks like
- Stacks populated within a minute; Operations within five.
- Backends show a last-observed time that advances every minute.
- Evidence coverage on Operations shows a collection start time per backend equal to when you started Marolum. Everything before that is Before coverage began, forever.
- The expiry worker card on Data & Retention reads Succeeded after its first pass.
What to expect over the first day
- Update history from before Marolum started appears as far back as the backend still holds it. Marolum copies it into its own record, so from now on it survives the backend's pruning.
- Operations that Pulumi ran without a runner show a backend source and Changes not reported only where the backend record carried no counts; most updates carry them.
- A wrapped preview remains runner-only. For an update, the exact retained Marolum marker lets Marolum record that the runner and backend rows describe the same run. Both rows stay listed, each labelled by its source; if the runner never finalized, its row shows the backend's outcome marked adopted from correlated record. Without that marker, or if backend history was pruned before observation, no join is recorded. See Runner integration.
Next steps
- Add the rest of the team: Users and permissions.
- Take the first backup and write down the restore steps: Backup and disaster recovery.
- Decide on retention: Database integration.
- Know what the build cannot do before someone asks: Known limitations.